There’s a newer version of Cinebench Available Here.
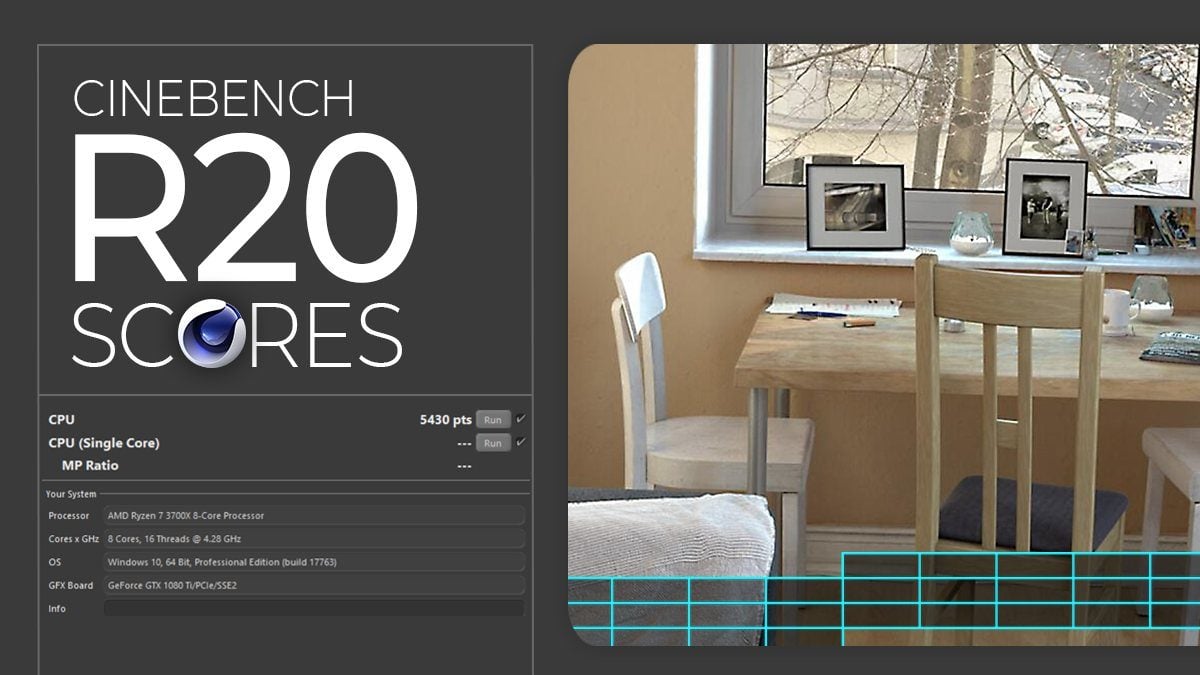
Cinebench R20 is based on technology of the well-known Digital Content Creation Software, Cinema 4D, but now utilizes the R20 Version’s Render Engine.
This updated rendering Benchmark now supports the AVX command set which will give us more realistic results of how modern Processors behave in multi-threaded workloads such as CPU Rendering.
Cinebench R20 is also great for finding the best CPUs for lightly-threaded workloads such as 3D Modeling and Animation and Video Editing.
Cinebench R20 Scores List
Cinebench R20 benches two CPU performance Values:
- Multi-Core-Score. This score will tell you how fast the CPU is in multi-processing tasks that utilize all of the available Cores. This includes rendering, encoding and other computational multi-threaded work
- Single-Core Score. The Cinebench R20 Single Core Score tells you how fast the CPU is when only a single Core is utilized. This is often a good metric for Software and Viewport snappiness and overall active work performance
▮ = AMD | ▮ = Intel
| CPU Name | Cores | Ghz | Single Score | Multi Score |
|---|---|---|---|---|
| Intel i5 12600K | 10 | 3.7 | 742 | 7022 |
| Intel i7 12700K | 12 | 3.6 | 755 | 8911 |
| Intel i9 12900K | 16 | 3.2 | 778 | 10632 |
| AMD Threadripper Pro 3975WX | 32 | 3.5 | 509 | 17768 |
| AMD Threadripper Pro 3995WX | 64 | 2.7 | 477 | 24463 |
| AMD Ryzen 7 5700G | 8 | 3.8 | 582 | 5465 |
| AMD Ryzen 9 5980HX | 8 | 3.3 | 604 | 4560 |
| Intel i5 11600K | 6 | 3.9 | 598 | 4293 |
| Intel i7 11700K | 8 | 3.6 | 612 | 5615 |
| Intel i9 11900K | 8 | 3.5 | 645 | 6214 |
| AMD Ryzen 5 5600X | 6 | 3.7 | 599 | 4569 |
| AMD Ryzen 7 5800X | 8 | 3.8 | 629 | 6046 |
| AMD Ryzen 9 5900X | 12 | 3.7 | 636 | 8545 |
| AMD Ryzen 9 5950X | 16 | 3.4 | 649 | 10435 |
| AMD Ryzen 3 3300X | 4 | 3.8 | 499 | 2597 |
| Intel i3 10320 | 4 | 3.8 | 477 | 2444 |
| Intel i5 10500 | 6 | 3.1 | 467 | 3392 |
| Intel i7 10700K | 8 | 3.8 | 497 | 5292 |
| Intel i9 10900K | 10 | 3.7 | 524 | 6399 |
| AMD Threadripper 3990X | 64 | 2.9 | 501 | 24803 |
| Intel i9 10980XE | 18 | 3.0 | 480 | 8846 |
| AMD Threadripper 3970X | 32 | 3.7 | 509 | 17448 |
| AMD Threadripper 3960X | 24 | 3.8 | 510 | 13551 |
| Intel Xeon Platinum 8160 | 24 | 2.1 | 286 | 5259 |
| AMD Epyc 7601 | 32 | 2.2 | 307 | 7445 |
| AMD Ryzen 3 2200G | 4 | 3.5 | 308 | 1307 |
| AMD Epyc 7451 | 24 | 2.3 | 317 | 6768 |
| Intel Xeon Gold 6148 | 20 | 2.4 | 320 | 6342 |
| AMD Ryzen 5 2500U | 4 | 2.0 | 328 | 1352 |
| AMD Ryzen 7 1700 | 8 | 3.0 | 331 | 3189 |
| Intel i7 8700 | 6 | 3.2 | 331 | 3547 |
| AMD Ryzen 5 1500X | 4 | 3.5 | 341 | 1811 |
| AMD Ryzen 7 1700X | 8 | 3.4 | 344 | 3336 |
| AMD Ryzen 7 2700U | 4 | 2.2 | 349 | 1387 |
| AMD Ryzen 5 3500U | 4 | 2.1 | 354 | 1483 |
| AMD Ryzen 5 1600 | 6 | 3.2 | 357 | 2501 |
| Intel i7 8650U | 4 | 1.9 | 365 | 1299 |
| AMD Ryzen 7 3700U | 4 | 2.3 | 367 | 1515 |
| AMD Ryzen 5 2600 | 6 | 3.4 | 374 | 2736 |
| Intel Xeon Platinum 8180 | 28 | 2.5 | 376 | 8585 |
| AMD Ryzen 7 1800X | 8 | 3.6 | 381 | 3587 |
| AMD Ryzen 5 1600X | 6 | 3.3 | 389 | 2764 |
| AMD Ryzen 5 2400G | 4 | 3.6 | 391 | 1911 |
| AMD Epyc 7702P | 64 | 2.0 | 393 | 18864 |
| Intel i5 8600 | 6 | 3.1 | 395 | 2051 |
| Intel i5 8300H | 4 | 2.3 | 397 | 1689 |
| AMD Threadripper 2990WX | 32 | 3.0 | 398 | 11463 |
| AMD Ryzen 3 PRO 1200 | 4 | 3.1 | 399 | 1558 |
| Intel i7 8850H | 6 | 2.6 | 403 | 2468 |
| AMD Ryzen 7 2700 | 8 | 3.2 | 403 | 3448 |
| AMD Threadripper 1900X | 8 | 3.8 | 403 | 3678 |
| Intel i5 8600K | 6 | 3.6 | 406 | 2181 |
| AMD Threadripper 1920X | 12 | 3.5 | 406 | 5326 |
| Intel i5 8400 | 6 | 2.8 | 411 | 2291 |
| AMD Ryzen 7 2700X | 8 | 3.7 | 411 | 3956 |
| AMD Threadripper 1950X | 16 | 3.4 | 411 | 6731 |
| AMD Ryzen 5 3400G | 4 | 3.7 | 417 | 1995 |
| AMD Threadripper 2970WX | 24 | 3.0 | 418 | 9624 |
| Intel i7 8750H | 6 | 2.2 | 419 | 2497 |
| AMD Ryzen 5 2600X | 6 | 3.6 | 421 | 3048 |
| AMD Threadripper 2920X | 12 | 3.5 | 439 | 5843 |
| Intel i7 9750H | 6 | 2.6 | 442 | 2653 |
| Intel i9 9980XE | 18 | 3.0 | 448 | 8791 |
| AMD Threadripper 2950X | 16 | 3.5 | 449 | 7003 |
| Intel i9 9960X | 16 | 3.1 | 450 | 7920 |
| Intel i9 9940X | 14 | 3.3 | 451 | 6945 |
| Intel i9 9920X | 12 | 3.5 | 457 | 6032 |
| Intel i9 9900X | 10 | 3.5 | 458 | 5402 |
| Intel i9 7900X | 10 | 3.3 | 461 | 5286 |
| Intel i7 7700K | 4 | 4.2 | 466 | 2257 |
| Intel i7 9700KF | 8 | 3.6 | 466 | 3656 |
| Intel i7 9700K | 8 | 3.6 | 466 | 3656 |
| AMD Ryzen 5 3600 | 6 | 3.6 | 474 | 3539 |
| Intel i7 8700K | 6 | 3.7 | 479 | 3793 |
| Intel i5 9600KF | 6 | 3.7 | 481 | 2624 |
| Intel i5 9600K | 6 | 3.7 | 481 | 2624 |
| Intel i7 7800X | 6 | 3.5 | 481 | 3752 |
| AMD Ryzen 5 3600X | 6 | 3.8 | 492 | 3895 |
| AMD Ryzen 7 3700X | 8 | 3.6 | 494 | 4856 |
| Intel i9 9900KF | 8 | 3.6 | 500 | 4916 |
| Intel i9 9900K | 8 | 3.6 | 500 | 4914 |
| AMD Ryzen 7 3800X | 8 | 3.9 | 508 | 5054 |
| Intel i9 9900KS | 8 | 4.0 | 508 | 5227 |
| AMD Ryzen 9 3900X | 12 | 3.8 | 511 | 7100 |
| AMD Ryzen 9 3950X | 16 | 3.5 | 518 | 9165 |
| CPU Name | Cores | GHz | Single Score | Multi Score |
Download Cinebench R20 here
Download Cinebench R20 Benchmark for your System, it’s free, and test-drive your CPU to be able to compare it with the ones in this list.
After building a new PC anyone should test their new hardware with all kinds of benchmarks, such as Cinebench R20, to see if the hardware performs the way it should.
Download Cinebench R20
How to read these Scores
Ok, some more Info about these Cinebench Results: Cinebench Scores are linear.
This means a CPU that scores 2000 Cinebench points will be twice as fast (in Cinema 4D Rendering) as a CPU that scores 1000 Cinebench points.
Up to 256 threads are supported
In Cinebench R20, Maxon has significantly improved the scaling with many threads so that future processors can still be reliably tested: Up to 256 Threads are now supported.
Furthermore, a more complex ray-tracing scene is being used, which, according to the developer, requires eight times as much computing effort and four times as much memory compared to the now well-known scene from Cinebench R15.
Thanks to the photorealistic appearance of the rendered scene, the updated Benchmark should now also give a much better impression of what such programs are used for and what Cinema 4D is capable of in its newest version.
Once again, Cinebench R20 is a benchmark for single-threaded and multi-threaded CPU performance. The OpenGL Benchmark, that was included in Cinebench R15, has now been removed though, as it did not test the underlying OpenGL performance well.
Where to buy these CPUs?
CPUs are hard to find in stock and at reasonable prices right now, so be sure to check a couple of different sites to find the best deal.
That’s about it from us! What’s your Cinebench R20 score? Let us know in the comments!


141 Comments
19 July, 2023
Multi Core: 36834
Single Core: 2044
i9-13900KF
Nvidia GeForce Asus Tuf 4070Ti OC Edition
12 September, 2022
I have i5-11400, but i can’t seem to break the 10000 pts barrier in Cinebench R23 CPU Multi core. Any suggestion that i can do to achieve that? i already maximize the power consumption above 65W
10 June, 2022
just to remind us how much we have advanced from single core era :
(Laptop : Dell 1501 / specs:AMD turion x64 2.ghz – 4GB Ram ddr800 Dual / 128MB VGA ATI Xpress 1100 )
cinebench r15 score: 37
cinebench r20 score : 75
cinebench r23 score : 162
16 April, 2022
My set:
i5-11400F
ASUS PRIME B560A
24GB DDR4 HyperX Fury 3200MHz,
Sapphire Rx 470 8GB
SSD GOODRAM PX500 512,00 M.2
Results:
Cinebench R23 CPU Single core – 1394pts
Cinebench R23 CPU Multi core – 10225pts
3D Mark Time Spy – 4003pts
CPU score – 7938pts
GPU score – 3681pts
FurMark 1.29 – 4075pts 68fps 1920*1080
12 September, 2022
hey, how did you get 10225 pts in Cinebench R23 CPU Multi core? I have i5-11400, but i can’t seem to break the 10000 pts barrier. Any suggestion?